The Flint water crisis
In 2014-2016 the city of Flint MI, experienced a severe water quality crisis brought on by a shift to a new water source that was incompatible with the existing infrastructure. This mistake was compounded by poor management of the water treatment process and by repeated refusals by local and state officials to acknowledge that there was a problem. The result was hundreds of cases of lead poisoning and at least twelve deaths from Legionaire's disease.
FLINT TIMELINE
April 2014 To save money, state-appointed city manager switches water supply from Detroit Water (Lake Huron) to Flint River
June-Aug Residents complain of taste and odor
Aug 14 Fecal coliform detect – boil water advisory
Sept 5 2nd boil water advisory; GM quits using water (costs city $400,000)
Jan 2015 Detroit offers free reconnect; Flint leaders say no need, water is safe
Feb 26 Walters home tests 104 ug/L Pb; retests at 397
Mar 23 City council votes to reconnect; overruled by manager
Jun 24 EPA memo says water high in Pb
July 13 Manager and MI regulators say water is safe
Sept 8 VA Tech report: 40 % of homes have high Pb; MI regulators dispute findings
Sept 24 Pediatrician reports blood Pb levels in children 2 to 3 x prior to switch; MI regulators again dismiss findings
Oct 16 Switch back to Detroit water.
The timeline for Flint follows a pattern seen in other cities with water quality crises, such as Washington DC in 2004: A poorly thought out change - a failure to report bad results to the public - denial that there is a problem once the situation becomes public - attacks on the credibility of scientists who argue that there is a serious problem - and finally capitulation and expenditure of huge amounts to fix the situation.
Problem 1. New Source Water
The switch from Detroit River/Lake Huron water to Flint River water was made without sufficient knowledge of the existing materials and corrosion scales in the distribution system, and without needed testing of the interactions of the new water with existing pipe surfaces. The average water qualities of the two sources indicate considerable similarity of the two waters, except for much higher Na and Cl in the Flint River source, and this similarity might have conveyed a false sense of security. Lurking unsuspected and unreported in the water quality data, however, was much higher organic carbon (TOC) in the Flint water.
| Treated Water From Different Sources | ||
| Components | Detroit River/ Lake Huron | Flint River |
| pH | 7.38 | 7.89 |
| Na, mg/L | 4.6 | 18 |
| K | 0.8 | 1 |
| Ca | 22.5 | 40 |
| Mg | 5.8 | 3 |
| Al | 0.215 | 0.037 |
| Fe | 0.175 | 0.097 |
| Mn | 0.005 | 0.0037 |
| Alk | 106 | 118 |
| SO4 | 33.9 | 31 |
| Cl | 39.8 | 95 |
| PO4 | 1.05 | 0 |
| TOC, before treatment | 1.5-1.8 | 6.4 |
The high Cl and TOC are indicators of a polluted water source. Some of the excess Na and Cl in the Flint River is likely from road salting, but the molar quantities of Na and Cl are 0.78E-03 and 1.29E-03 moles/L. Thus, there is another source of Cl supplying 0.51E-03 moles/L, possibly from discharge of industrial waste. The presence of significant amounts of municipal or industrial waste is also inidcated by higher TOC in the Flint River (Leonardi and Gruhn, 2001), compared to the Detroit River, which runs 1.5 to 1.8 mg/L (Jasim et al., 2006). Heavy metal contents of Flint River water are also elevated:
| Heavy metals and chloride; Flint River v Detroit River | |||||
| Component | Flint | Flint | Detroit | Detroit | Ratio |
| Year | 2003 | 2008 | 2003 | 2008 | Flint/ Detroit |
| Chloride, mg/L | 97.3 | 66.4 | 8.72 | 16.0 | 6.63 |
| Chromium, ug/L | 2.4 | 2.1 | 0.31 | 0.40 | 6.34 |
| Copper, ug/L | 4.8 | 3.0 | 0.84 | 0.7 | 5.06 |
| Lead, ug/L | 4.6 | 2.7 | 0.33 | 0.19 | 14.04 |
| Mercury, ug/L | 0.009 | 0.005 | 0.003 | 0.0012 | 3.72 |
| Michigan Dept Environmental Quality 2013. MI/DEQWRD-13/005 | |||||
From alkalinity and pH alone, the new water source should not have posed a problem. The high Cl, however, would make the water more corrosive, and the higher TOC would promote bacterial activity that would lower Eh (see oxidation-reduction pdf). This in turn would destabilize Fe and Mn scales.
Problem 2. Failure to maintain constant conditions
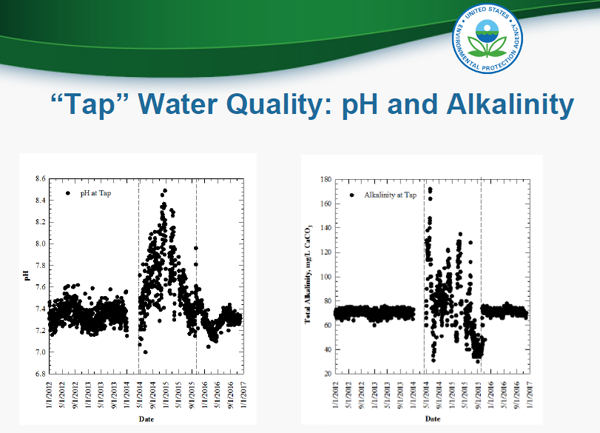
A successful water treatment plant will produce water with a consistent narrow range of important water quality parameters. The Detroit plants had been supplying Flint with stable water, but the switch to the Flint supply was followed immediately by severe swings in certain key variables, including pH and alkalinity:

Notice that akalinity oscillated between 1/2 and 2x the former stable value while pH varied from 7.0 to 8.5. Under these conditions, lead carbonate scales would have regulare and repeated alternations between conditions favorable for precipitation and for dissolution, preventing the establishment of a protective scale layer and destabilizing any existing carbonate scales.Data source: Darren Lytle USEPA 2017)
Problem 3. Failure to maintain sufficient disinfectant residual
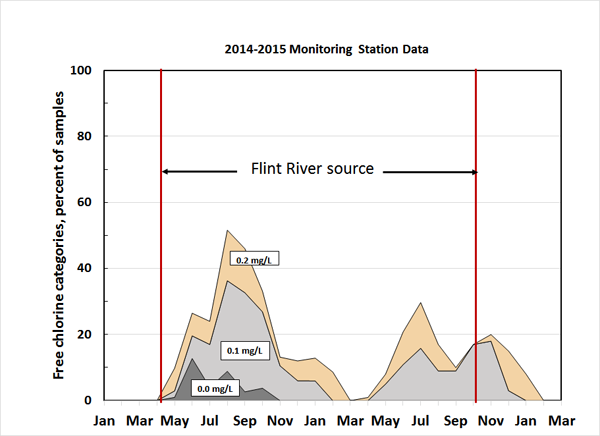
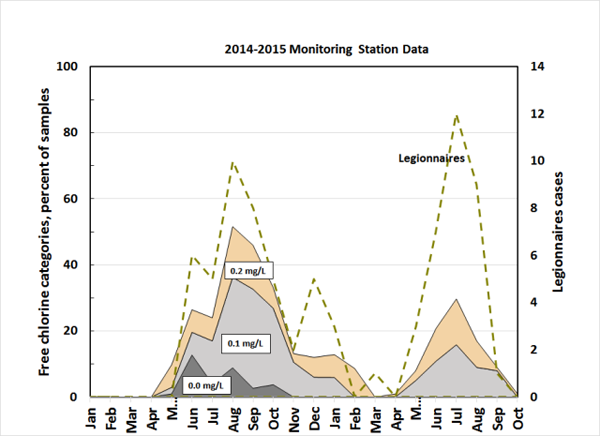
After the switch to the Flint River source, the chlorine demand in the system increased substantially and the operators were unable to maintain the proper level of disinfection in the system. Many samples fell below the 0.2 mg/L minimum and many others were at the minimum. Combining the failing and the substandard samples gives a picture of a compromised system during the summer months, when a third to one half of the system was too low in disinfectant.

The lead releases in Flint were accompanied by large releases of Fe (and likely Mn as well), indicating that the new water destabilized existing iron scales. There were many galvanized iron service lines, which would have been a source of this iron, but it seems likely that releases also occurred from unlined cast iron mains. It is also likely that this enhanced iron release was related to enhanced microbial activity in the system, in particular sulfate reduction. High organic carbon and low chlorine levels produce conditions favorable for the growth of sulfate-reducing bacteria, whose actions severely degrade water quality and corrode plumbing system components. Outbreaks of Legionaires disease coincident with these episodes of low oxidation potential confirm that microbial growth in the distribution system was enhanced by failure to adapt the system to the new water source.

Selected References and Data Sources
Lytle, D., 2017, EPA Region 5 Flint Data Summit, Chicago IL
https://www.epa.gov/flint/third-flint-data-summit-presentations
Flint Water Department, Monthly Operation Report of Water Treatment Plant, Archived Records Michigan Dept Environmental Quality
https://www.michigan.gov/flintwater/0,6092,7-345--377816--,00.html#Monthly%20Operation%20Reports
Hanna-Attisha, M., LaChance, J., Sadler, R.C. and Champney Schnepp, A., 2016. Elevated blood lead levels in children associated with the Flint drinking water crisis: a spatial analysis of risk and public health response. American journal of public health, 106(2), pp.283-290.
Leonardi, J.M. and Gruhn, W.J., 2001. Flint River Assessment (No. 27). Michigan Department of Natural Resources, Fisheries Division. With appendices.
Michigan Dept Environmental Quality 2013. Michigan's Water Chemistry Monitoring Program. MI/DEQWRD-13/005
Pieper, K.J., Tang, M. and Edwards, M.A., 2017. Flint water crisis caused by interrupted corrosion control: Investigating “ground zero” home. Environmental science & technology, 51(4), pp.2007-2014.
Saad Y. Jasim , Antonette Irabelli, Paul Yang, Shamima Ahmed & L. Schweitzer (2006) Presence of Pharmaceuticals and Pesticides in Detroit River Water and the Effect of Ozone on Removal, Ozone: Science & Engineering, 28:6, 415-423, DOI: 10.1080/01919510600985945
Zahran, S., McElmurry, S.P., Kilgore, P.E., Mushinski, D., Press, J., Love, N.G., Sadler, R.C. and Swanson, M.S., 2018. Assessment of the Legionnaires’ disease outbreak in Flint, Michigan. Proceedings of the National Academy of Sciences, 115(8), pp.E1730-E1739.